What are the signs of a failing custom fuel filtration unit? This question matters wherever clean fuel protects expensive engines, pumps, and injectors. A failing unit rarely announces itself with one dramatic symptom. More often, it whispers through darker filter media, unstable fuel pressure, and longer engine cranking.
Fuel-systems engineer Laura Bennett explains, “A filter rarely fails alone; it usually reports a problem somewhere upstream.” That observation deserves attention. Water may collect inside the bowl. Sediment may appear as fine rust-colored dust. A differential-pressure gauge may climb beyond its normal operating range. The engine can then lose power under load, surge at idle, or stop unexpectedly.
Watch for repeated filter changes. That pattern may indicate contaminated storage tanks, damaged seals, poor fuel handling, or an incorrectly sized filtration unit. Leaks around fittings also deserve careful inspection. Small air bubbles in a transparent fuel line can reveal loose connections or a failing seal.
The diagnosis is not always neat. A restricted filter can resemble a weak pump or a faulty injector. Guessing can waste time and replacement parts. Technicians should record pressure readings before and after filtration. They should inspect drained fuel under proper lighting. A clean sample container often reveals water layers or suspended particles.
Custom systems need special attention. Flow rate, fuel type, temperature, and installation orientation all affect performance. One overlooked detail can shorten service life. Regular inspection remains practical, but inspection alone is not enough. Reliable maintenance combines measured data, visible evidence, and the unit’s operating history.
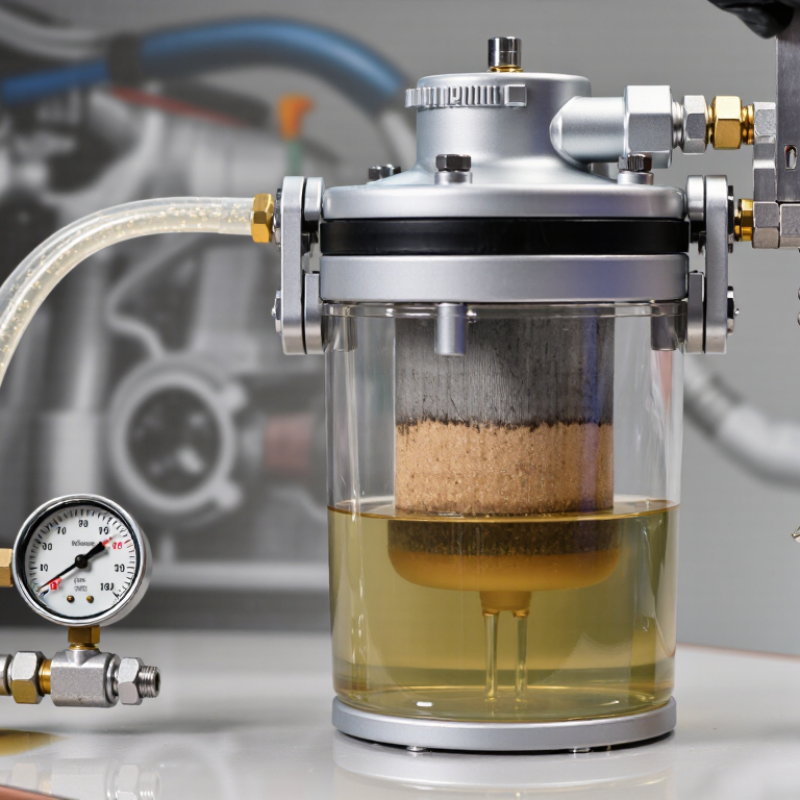
In a custom China-built fuel filtration system, failure does not always mean a filter is completely blocked. It can mean the unit no longer delivers clean fuel at the required flow and pressure. A sudden rise in differential pressure may point to a loaded element, while falling pressure downstream can signal restricted flow. Check readings against the system’s operating range, not a generic threshold.
Look for small, observable clues. A damp seal, fuel stains around a housing joint, or recurring air bubbles can indicate leakage or poor sealing. Dark deposits in a transparent bowl may reveal contamination, but appearance alone cannot identify its source. Record when symptoms occur, such as during cold starts or heavy demand. Details matter.
Custom systems may use different housings, seals, port layouts, and sensor settings. A replacement element that fits physically may still have unsuitable filtration capacity or flow characteristics. Verify the drawings, element specification, and pressure limits supplied for that particular unit. Inspect connections and confirm sensor readings with a suitable gauge. Do not assume the sensor is right. It can drift.
A careful diagnosis separates an element problem from fuel contamination, a damaged seal, or an installation mismatch. I would also question the first explanation if replacing the element does not restore stable pressure. Repeated failure deserves investigation. Keep maintenance records, including readings and operating conditions, so the next inspection has evidence rather than guesswork.
For a custom fuel filtration unit, an ISO 4406 code is more than a laboratory label. It records particle concentrations at three size bands: ≥4, ≥6, and ≥14 μm(c). Under ISO 4406, code 18 represents roughly 1,300–2,500 particles per millilitre at the ≥4 μm(c) band; code 16 represents 320–640 at ≥6 μm(c); code 13 represents 40–80 at ≥14 μm(c). These ranges come from the standard’s particle-count scale, not from a universal “safe” limit. Set the target against the equipment maker’s requirements and the system’s actual operating conditions.
Watch the trend. If repeated samples shift from 18/16/13 to 19/17/14, particle counts have risen across all three bands. That may indicate a loaded element, damaged seals, or contamination introduced during maintenance; the code alone cannot identify the cause.
ISO 11171 specifies calibration for automatic particle counters, so comparable sampling and calibrated instruments matter. Take samples from the same live-flow point, not a stagnant drain. A single odd result happens. Check it again. One practical weakness is easy to miss: careless sampling can make a sound filter appear to be failing. Pair the cleanliness code with differential pressure, flow, and inspection records before replacing an element.
A rising pressure drop across a fuel filter can signal restriction, but no single value applies to every unit. Check the filter and engine manufacturer’s specified changeout limit first. ISO 16889 evaluates filter performance through a multipass test, including particle removal and contaminant capacity; it does not set one universal in-service replacement pressure. That distinction matters.
For a practical check, record clean-filter differential pressure at a stable fuel flow, then compare readings under the same conditions. A steady increase toward the unit’s stated limit deserves attention. A sudden jump, reduced engine power, or difficult starting makes the warning more urgent. For example, a 10 kPa increase may be significant on one system and normal on another. Context matters. Use a calibrated differential gauge, and inspect for cold, viscous fuel or a partly closed valve before blaming the element. Small details get missed.
Do not wait for a severe pressure drop to confirm blockage. A clogged filter can starve the pump, while a damaged seal may let unfiltered fuel bypass the media without a dramatic gauge reading. Record pressure, fuel temperature, flow, and operating hours during checks. If the reading fluctuates, repeat the test; vibration or trapped air can distort it. ISO 16889 provides a useful test framework, but field replacement decisions still depend on the equipment maker’s limits and operating conditions.
A fuel filtration unit can look normal while its performance declines. A rising differential pressure may indicate a loaded element, but pressure alone does not reveal what is passing through. Beta ratios provide a clearer particle-count measure. At a stated particle size, a beta ratio of 200 means roughly one particle downstream for every 200 upstream. That is about 99.5 percent capture at that size—not a guarantee for every contaminant. Check that test conditions and particle sizes match the unit’s specification.
Water levels tell a different part of the story. A rising reading in a sump, drain, or water sensor can signal poor separation, excessive water loading, or a damaged element. Look for cloudy fuel, beads of water in a sample jar, and repeated alarms after draining. Small details matter. A single reading may be misleading, so compare trends and confirm sensor calibration before replacing parts.
Field checks should pair beta-ratio data with water measurements and differential pressure. If particle counts downstream climb while pressure remains ordinary, the element may be bypassing or incorrectly seated. If water rises quickly, inspect seals, drains, and the separator stage. These clues do not always point to one fault; sampling errors happen, too. Record operating hours, fuel temperature, and recent maintenance. The pattern is often more useful than one impressive number.
| Inspection Metric | What It Measures | Example Reading | Possible Indication | Recommended Check |
|---|---|---|---|---|
| Beta ratio at 4 µm | Ratio of upstream to downstream particles at or above the stated particle size. | β4 = 200; calculated efficiency = 99.5% | A lower beta ratio than the element’s documented baseline can indicate reduced fine-particle capture or a test-condition difference. | Compare results using the same test method, fluid, flow rate, and particle-size convention; inspect the element and seals. |
| Beta ratio at 6 µm | Particle-removal performance at the specified size, measured under controlled conditions. | β6 = 1,000; calculated efficiency = 99.9% | A falling ratio may signal media damage, bypass leakage, incorrect installation, or inconsistent testing. | Check the element specification and differential pressure; verify that the bypass valve is not opening prematurely. |
| Water content in fuel | Water concentration, commonly reported in mg/kg (approximately ppm by mass for dilute mixtures). | 250 mg/kg measured downstream, compared with 80 mg/kg upstream | A downstream increase can suggest water carryover, a saturated coalescing element, damaged media, or sampling error. | Repeat representative upstream and downstream samples; inspect drains, seals, and the water-separation element. |
| Free water in the sump | Water collected at the vessel bottom or indicated by a level sensor. | Water level rises between scheduled drain checks | Rapid accumulation may reflect increased water ingress, inadequate draining, or a separation-stage problem. | Drain according to the operating procedure and check the source fuel, vessel slope, and level indication. |
| Differential pressure across the element | Pressure difference between the filter inlet and outlet at a stated flow rate. | Pressure drop increases from the clean-element baseline | Rising differential pressure can indicate particle loading; an unexpectedly low reading can also occur with bypass or a damaged element. | Compare with the element maker’s replacement limit at comparable flow and temperature; check the gauge and bypass circuit. |
| Downstream particle count | Number of particles measured per fluid volume in defined size ranges. | Downstream counts rise while upstream counts remain similar | May indicate loss of capture efficiency, seal leakage, or contamination introduced after the filter. | Use clean sampling equipment and consistent sampling points; inspect connections and downstream components. |
| Water-separation performance | Ability of the installed separation stage to remove dispersed or free water under specified conditions. | Persistent downstream water after a stable operating period | Possible causes include unsuitable element selection, surfactant contamination, excessive flow, or element deterioration. | Confirm fuel compatibility, flow and temperature conditions, element condition, and the applicable test procedure. |
Interpretation note: Beta-ratio efficiency is calculated as (1 − 1/β) × 100%. Readings and water limits are application- and test-dependent examples, not universal acceptance limits. Use the fuel-system design requirements and the applicable element specifications when setting alarms or replacement criteria.
A failing fuel filtration unit often gives small warnings before performance drops. The engine may crank longer, idle unevenly, or lose power when climbing a hill. Water or dark sediment in the separator bowl can provide a useful clue.
These signs are not proof of a clogged filter; air leaks, poor fuel quality, or electrical faults can look similar. Check the equipment manual and service history before replacing parts. A pressure or vacuum reading, taken at the specified test point, can help confirm restriction.
Work with the engine off and cool, in a ventilated area. Relieve pressure as directed by the manufacturer, then inspect hoses, clamps, seals, and the filter housing for leaks or cracks.
Drain collected water into an appropriate container, and replace the filter if its interval has passed or restriction is confirmed. Use the specified element and fit new seals where required. Keep dirt out of open connections.
Small detail, big difference.
Prime the system using the approved procedure, then start the engine and check carefully for leaks and stable operation. If symptoms remain, stop and investigate rather than repeatedly changing filters.
I have seen rushed servicing introduce air into the line; it is an easy mistake, and worth reflecting on.
No. Failure can mean the unit cannot deliver clean fuel at the required flow and pressure. A sudden pressure rise may indicate a loaded element. Falling downstream pressure may indicate restricted flow. The element might not be the only problem.
Compare readings with the unit’s specified operating range. Do not rely on one universal pressure value. Record clean-filter pressure at stable flow, then repeat under matching conditions. A steady increase toward the stated limit needs attention. Context matters.
No. A 10 kPa increase may be serious in one system and normal in another. Check fuel temperature, flow, valve position, and operating hours. Cold, thick fuel can create misleading readings. Small details matter.
Look for damp seals, fuel stains, or wet housing joints. Recurring air bubbles also deserve attention. These clues can indicate poor sealing or air entering the system. Clean the area and inspect again. Evidence can be imperfect.
Dark deposits show contamination may be present. They cannot confirm its source. Record their color, location, and appearance. Check when the deposits return. The fuel source, tank, seal, or installation may need investigation.
Yes. Physical fit does not guarantee suitable filtration capacity or flow performance. Verify the element specification, drawings, pressure limits, and sealing details. A nearly correct part can still cause unstable pressure. That possibility is easy to miss.
Compare the sensor with a suitable calibrated pressure gauge. Confirm readings during steady flow and known operating conditions. Sensors can drift. If values disagree, do not automatically trust the sensor. Recheck the connection and gauge setup.
Record pressure, fuel temperature, flow, operating hours, and symptom timing. Note whether problems occur during cold starts or heavy demand. Write down valve positions and visible leakage. A short log is better than memory.
Question the original diagnosis. Inspect seals, valves, sensors, fuel contamination, and installation compatibility. Repeated failure deserves a wider investigation. Do not keep replacing elements without evidence. The first explanation may be wrong.
This article explains how to recognize failure in a custom fuel filtration unit built for a specific system. What are the signs of a failing custom fuel filtration unit? Common clues include worsening ISO 4406 cleanliness codes, rising pressure drop across the filter, reduced fuel flow, and increasing water or particle levels downstream. Together, these readings can show that a filter is becoming blocked, losing its ability to capture contaminants, or no longer separating water effectively.
The guide also describes how to interpret beta ratios and water measurements alongside operating data, rather than relying on a single symptom. It outlines a practical approach to diagnosis, inspection, servicing, and replacement, including checking sensors and connections, confirming readings under normal operating conditions, and selecting a compatible replacement element. Timely action can help restore filtration performance and reduce the risk of contamination-related wear in fuel-system components.

Tolev Auto